Top

Copy and paste the following code for attribution and get our Free License. Don’t want to provide attribution? Go Premium for more usage rights without attribution!

PEST Analysis Diagram, 03143, Business Models — PoweredTemplate.com
PEST Analysis Diagram, Slide 2, 03143, Business Models — PoweredTemplate.com
PEST Analysis Diagram, Slide 3, 03143, Business Models — PoweredTemplate.com
PEST Analysis Diagram, Slide 4, 03143, Business Models — PoweredTemplate.com
PEST Analysis Diagram, Slide 5, 03143, Business Models — PoweredTemplate.com
PEST Analysis Diagram, Slide 6, 03143, Business Models — PoweredTemplate.com
PEST Analysis Diagram, Slide 7, 03143, Business Models — PoweredTemplate.com
PEST Analysis Diagram, Slide 8, 03143, Business Models — PoweredTemplate.com
PEST Analysis Diagram, Slide 9, 03143, Business Models — PoweredTemplate.com
PEST Analysis Diagram, Slide 10, 03143, Business Models — PoweredTemplate.com
PEST Analysis Diagram, Slide 11, 03143, Business Models — PoweredTemplate.com
PEST Analysis Diagram, Slide 12, 03143, Business Models — PoweredTemplate.com
PEST Analysis Diagram, Slide 13, 03143, Business Models — PoweredTemplate.com
PEST Analysis Diagram, Slide 14, 03143, Business Models — PoweredTemplate.com
PEST Analysis Diagram, Slide 15, 03143, Business Models — PoweredTemplate.com
PEST Analysis Diagram, Slide 16, 03143, Business Models — PoweredTemplate.com

Quick Navigation Guide

Tap or click on the thumbnails here to view more images. You can also scroll left or right above or use the arrow keys on your keyboard.

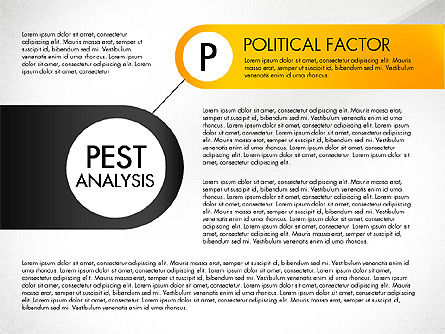
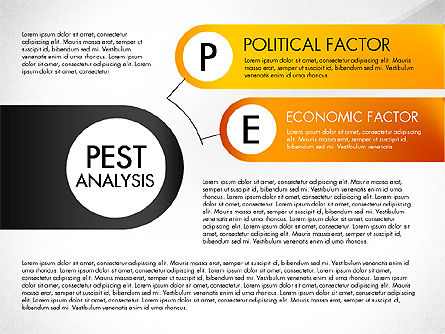
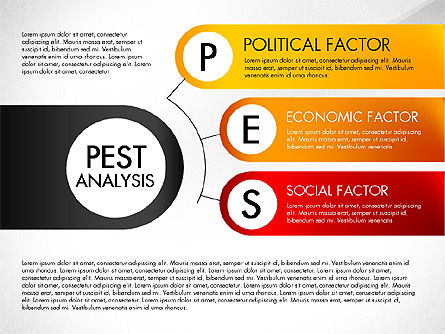
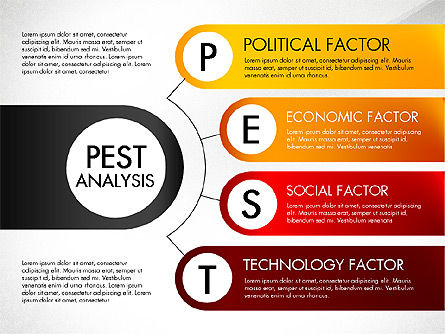
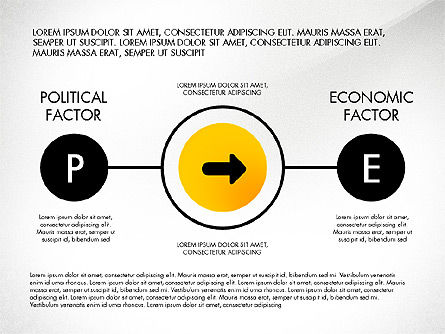
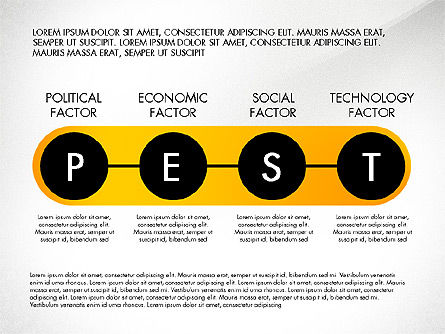
PEST Analysis Diagram (for PowerPoint and Google Slides)

Since July 18, 2004
ID: 03143
4.9 of 5(16)
Premium resource

Unlock this file and gain access to other Premium resources.

Go Premium and Download!  |  Already Premium? Sign in

Premium resource

Unlock this file and gain access to other Premium resources.

Go Premium and Download!  |  Already Premium? Sign in

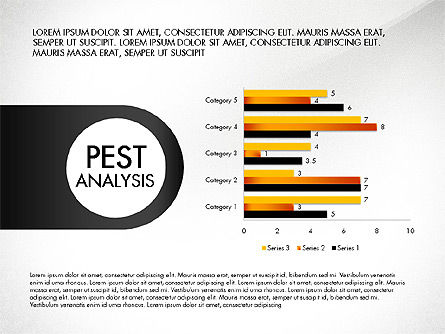
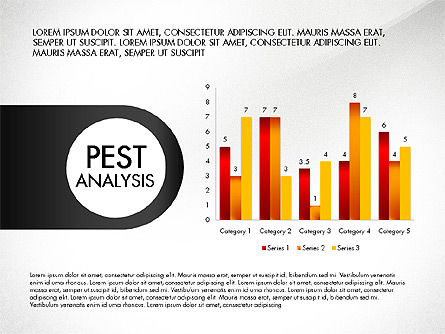
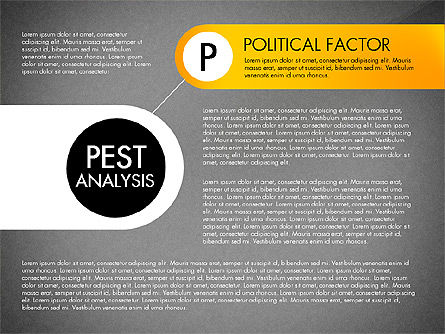
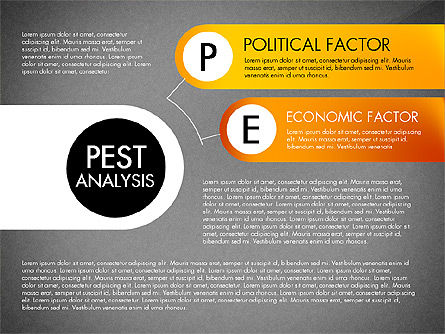
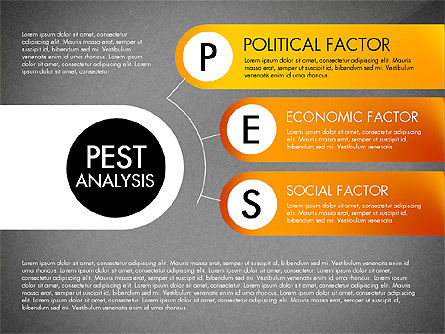
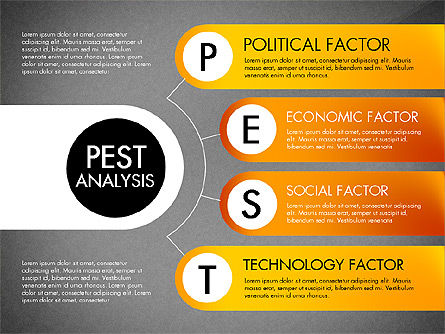
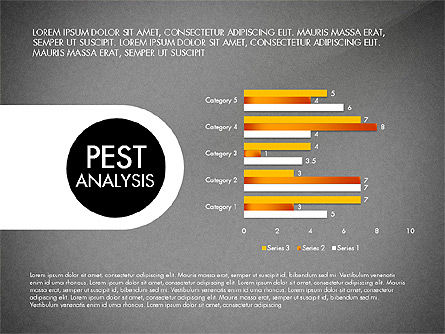
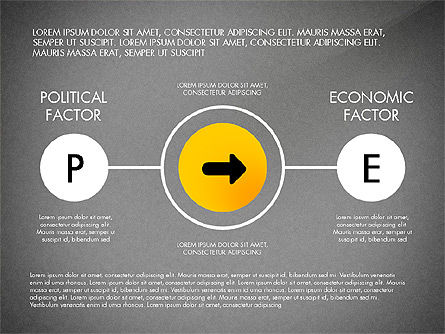
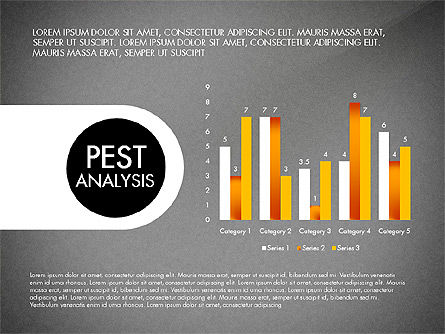
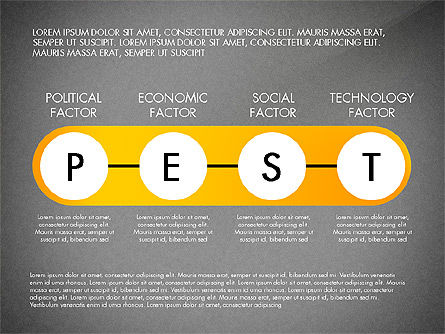
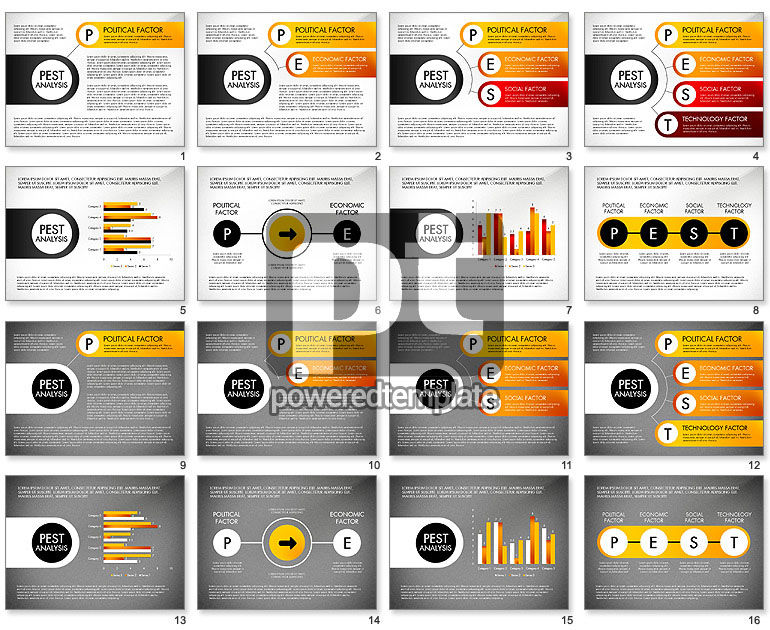
From now you can get a perfect strict PEST Analysis Diagram for your needs. Just put your text and data to these vivid, easy to use bar charts, column charts and tables and make your speech clear and unforgettable. It is the best way to represent political, economic, social and technology factors, analyze the opportunities of your goals achievement, describe your mission, values and priorities. Download Free Samples. Charts and Diagrams Features.More...
Categories: Business Models
PEST Analysis Diagram

Related Items

You have not viewed any products yet.

Start browsing our template library and here will be stored your history of viewed products.

Use "Favorites" to save products you find interesting, to compare them and add to cart. To add products in favorites you must first register or login. Registration is Free!

To add a product to "Favorites" simple click on near product's image.